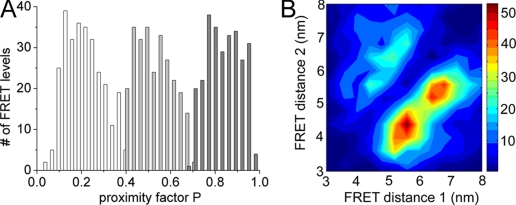
FIGURE 3.
Proximity factor distribution (A) and FRET transition density plot (B) of F0F1-ATP synthases during ATP hydrolysis. At least two distinct FRET levels had to be detected within a photon burst to be added to the histograms. A, proximity factors for FRET level L as white bars, for Mas light gray bars, and forHas dark gray bars (825 FRET level in total). B, FRET transition density plot with chromophore distances between EGFP and Alexa568 bound to ε56.

