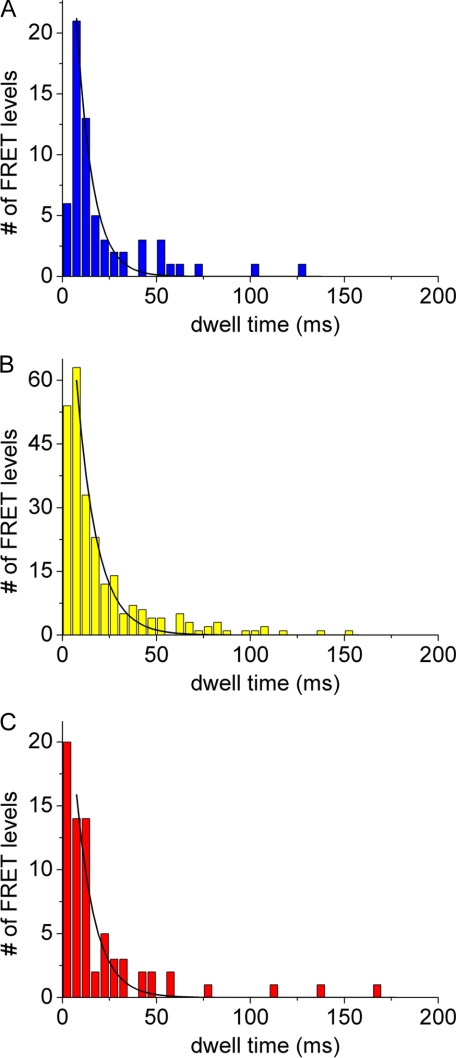
FIGURE 4.
Dwell time distributions of FRET levels L (blue bars, 63 level) (A), M (yellow bars, 247 level) (B), and H (red bars, 71 level) (C) during ATP hydrolysis in the presence of 1 mm ATP are shown. F0F1-ATP synthases were labeled with EGFP at the C terminus of a and with Alexa568 at ε56. Dwell times were binned in 5-ms intervals and fitted by monoexponential decays (black curves).

