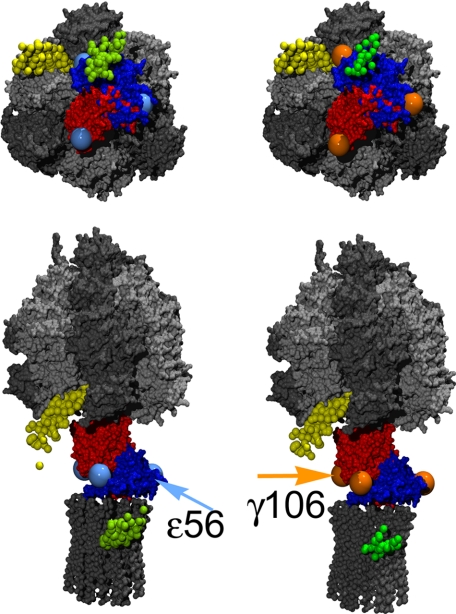
FIGURE 6.
Individual positions of EGFP (small green balls) according to single molecule FRET triangulation using the FRET pair a-EGFP-ε56-Alexa368 (left side) or a-EGFP-γ106-Alexa568 (right side). The small yellow balls are the individual positions for the FRET acceptor Cy5 at b64 with respect to TMR at ε56 (positions recalculated from previous FRET data of Zimmermann et al. (11)). The γ subunit is shown in red, the ε subunit is in blue. Large light blue balls represent the apparent ε56 stopping positions upon 120° rotation of γε during catalysis. Large orange balls represent the three γ106 positions. Arrows indicate the fluorophore positions at the ε or γ subunit, respectively, for the rotor orientation shown in the images. Upper images show F1 when viewed from the membrane. In the lower images F0F1 are oriented with b2 subunits to the left side.

