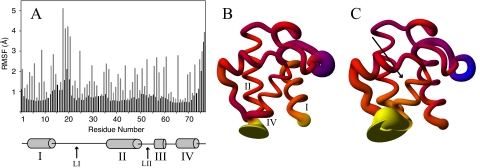
FIGURE 2.
A, RMSF of apo-ACP backbone (black) and side-chain (gray) atoms, shown for each residue. B, holo-ACP in sausage representation, where the thickness of the ribbon is proportional to the backbone fluctuations seen during the simulation. The diagram is colored according to the difference in fluctuations compared with apo-ACP, ranging from blue (less flexible than apo-ACP) to yellow (more flexible than apo-ACP) and red being similarly flexible to apo-ACP. C, sausage representation of octanoyl-ACP colored analogous to B. The arrow indicates the position of the bound acyl chain.

