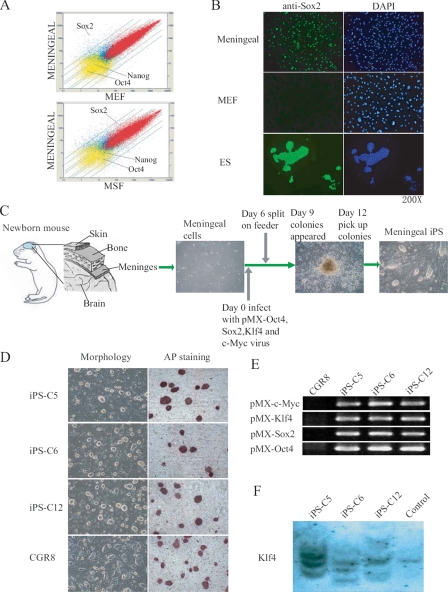
FIGURE 1.
Generation of iPS cells from mouse meningeal cells. A, DNA microarray comparison between meningeal cells and the indicated cell types. A scatter-plot representation of the expression values for all probe sets is shown. Positions of Oct4, Sox2, and Nanog are marked with arrows. The parallel lines indicate 2-, 3-, 5-, and 10-fold changes in gene expression (up or down). B, microscope immunofluorescence for Sox2 (green) of meningeal cells and MEF. 4′,6-Diamidino-2-phenylindole (DAPI) staining is shown in blue. Bars indicate the magnification. C, scheme showing the extraction of meningeal membranes from newborn mice and subsequent transduction of meningeal cells using a mixture of retroviruses. D, cells derived from three selected iPS clones formed ES-like colonies and showed positive for AP staining. E, semiquantitative RT-PCR demonstrated integration of the corresponding transgenes in the genome of the three meningeal iPS clones. Sets of primers that amplify both the vector and the transduced factor were used. F, Southern blot also demonstrated integration of the Klf4 transgene in the genome of the three iPS clones. R1 mouse ES cells were used as a control.

