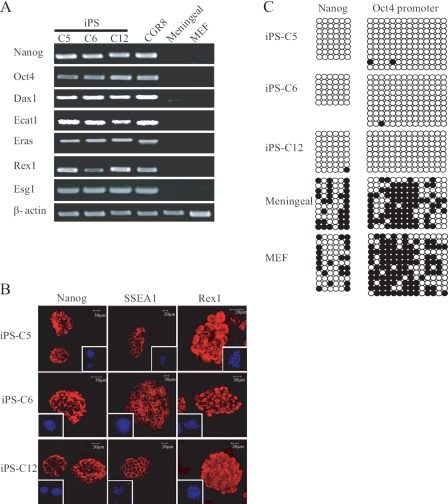
FIGURE 2.
Characterization of meningeal iPS clones. A, semiquantitative RT-PCR demonstrated that the three iPS clones express key ES markers; CGR8 mouse ES cells, uninfected meningeal cells, and MEF were used as positive control and negative controls, respectively. B, confocal immunofluorescence microscopy showed homogeneous expression of Nanog, Rex1, and SSEA1 in the selected iPS clones. Bars indicate the magnification. The square on the margin shows 4′,6-diamidino-2-phenylindole staining in lower magnification. C, analysis of the methylation state of the Oct4 and Nanog promoters using bisulfate sequencing. Open circles indicate unmethylated, and filled circles indicate methylated CpG dinucleotides.

