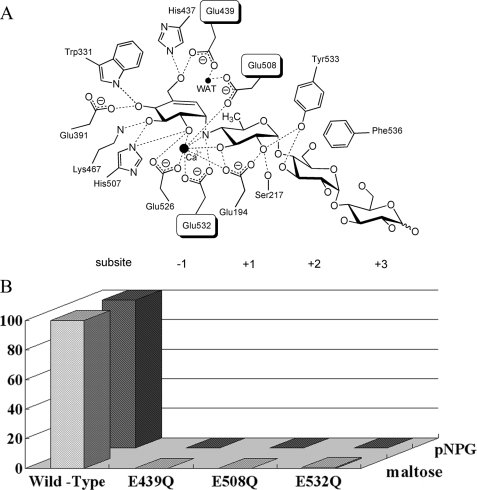
FIGURE 5.
Catalysis by SusB. A, schematic drawing of the hydrolytic center of SusB with the acarbose binding. Hydrogen bonds are shown as dotted lines, and Ca2+ and water molecules as black spheres. B, hydrolysis activities of 3 SusB mutants. The saturated activities relative to those of the wild type SusB are shown. The activity measurements were performed three times, and the experimental values were averaged.

