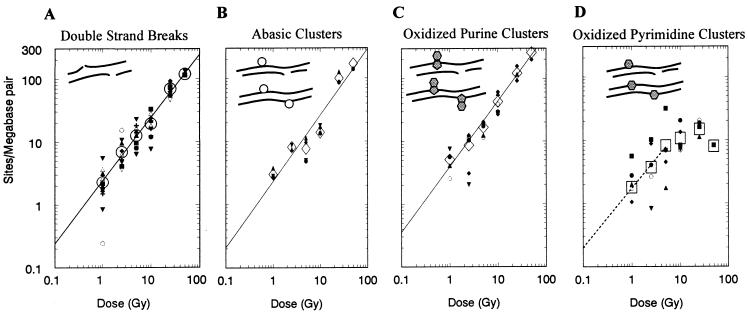
Figure 3.
Schematic representation of the configuration of clustered lesion classes in DNA and dose responses for their induction in isolated T7 DNA by exposure to γ rays. (A) DSBs. (B) Abasic clusters (abasic site opposite SSB, upper diagram, or abasic site, lower diagram) converted to a DSB by Nfo protein digestion. (C) Oxidized purine clusters (oxidized purine opposite SSB, upper diagram, or oxidized purine, lower diagram) converted to a DSB by treatment with Fpg protein. (D) Oxidized pyrimidine clusters (oxidized pyrimidine opposite SSB, upper diagram, or oxidized pyrimidine, lower diagram) converted to a DSB by treatment with Nth protein. In B–D, levels of radiation-induced DSB are subtracted. Clusters of oxidized purine opposite oxidized pyrimidine, and of multiple lesions on opposing strands are not considered. Symbols: small, results of 2–10 individual gels; large, averages; A–C, least-squares lines fit on a log–log plot of the averages of the site frequencies as a function of the doses; D, least-squares line for 0- to 5-Gy data.

