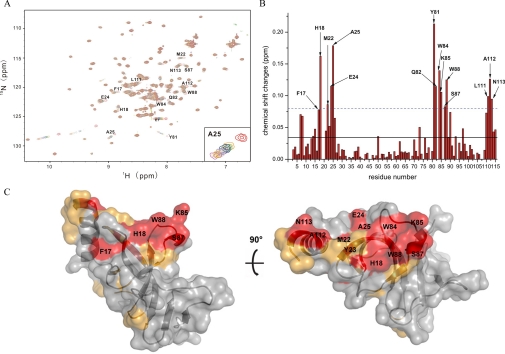
FIGURE 3.
NMR titrations of the Eaf3 chromo domain with the H3K36me3 peptide. A, superposition of 1H-15N HSQC spectra of the 15N-labeled Eaf3 chromo domain in unliganded form (red) and in complex with the H3K36me3 peptide at a molar ratio of 1:2 (orange), 1:3 (green), 1:4 (blue), 1:5 (purple), 1:6 (gray), 1:7 (pink), 1:8 (gold), and 1:10 (magenta). B, average chemical shift changes versus residue number of the 15N-labeled Eaf3 chromo domain. Solid line, average value of chemical shift changes; dashed line, sum of the average value and S.D. The blank column means that the residue cannot be assigned. C, molecular surface representation of the Eaf3 chromo domain (short form) showing the potential binding site for the methylated H3K36 peptide. Residues exhibiting a chemical shift change larger than the average value are colored orange, and residues exhibiting chemical shift change larger than the average plus S.D. are colored red.

