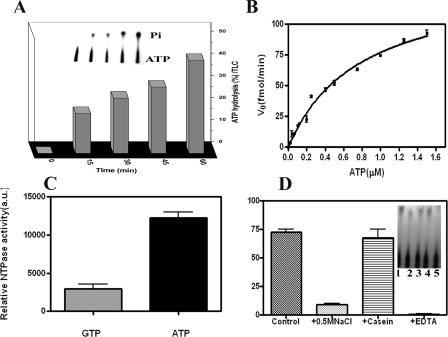
FIGURE 1.
Functional characterization of Rv3868. A, the protein was incubated with [γ-32P]ATP for various time intervals to observe the ATPase activity. The amount of ATP hydrolyzed at each time point is shown as a percentage of the original [γ-32P]ATP before incubation at 30 °C. Each point is the average of the values obtained from three independent experiments. The insets represent the autoradiography profiles taken from a TLC. B, Michaelis-Menten plot of ATP hydrolysis by Rv3868. C, relative NTP hydrolysis (arbitrary units) when [γ-32P]ATP and [γ-32P]GTP were used as substrates of Rv3868. D, the effect of NaCl, casein, and EDTA on ATPase activity. The first bar represents the control experiment. Inset, lanes 1-5 represent the control experiment, the activity in the presence of 0.5 m NaCl, 5 or 10 μg of casein, and 10 mm EDTA, respectively.

