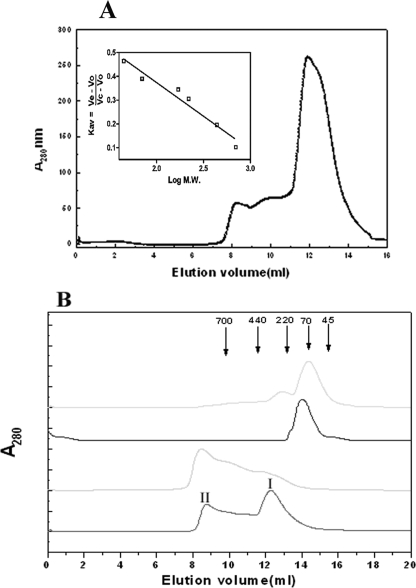
FIGURE 2.
Protein and salt concentration dependence of the oligomerization in Rv3868. A, size exclusion chromatography profile of Rv3868 (∼3 μm) on a Superdex 200HR column in 25 mm Tris, 50 mm NaCl (pH 7.0), at 25 °C. The inset represents the calibration curve of the column. B, Rv3868 at concentrations of ∼7-15 μm (bottom) and >15 μm (second from bottom) was incubated for 1 h at 25 °C before centrifugation and applied onto a Superdex 200HR column in 25 mm Tris buffer. The hexameric form is represented by I, whereas II refers to a high order oligomeric form. The second from top and top lines represent the elution profile in the presence of 500 and 750 mm NaCl, respectively, in the same buffer. Elution volumes corresponding to the Mr of standard proteins used in calibration are indicated by arrows.

