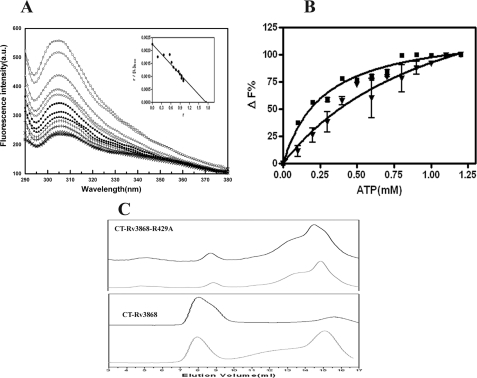
FIGURE 6.
Steady-state nucleotide binding of CT-Rv3868. A, emission spectra of 1 μm CT-Rv3868 (□) and in the presence of, for example, 0.1 mm (○), 0.2 mm (▵), 0.5 mm (▪), 0.7 mm (▴), and 1.0 mm (+) ATP, respectively. Inset, Scatchard plot of the titration of CT-Rv3868 (Form III) and ATP according to Equation 5 to determine the binding stoichiometry of the complex. B, steady-state binding of ATP to CT-Rv3868 (▪) and CT-Rv3868R429A (▾). Data are plotted as the percentage of fluorescence change versus ATP concentration (mm). C, ATP-induced alterations in the molecular dimension of CT-Rv3868R429A (top) and CT-Rv3868 (bottom). Shown are size exclusion chromatographic profiles for proteins (black) and upon incubation with 2.0 mm ATP (gray) on a Superdex-200 column at pH 7.0 and 25 °C. The columns were run with the same concentration of ATP in which the protein sample was incubated. The samples were incubated for 1 h in ATP before column chromatography.

