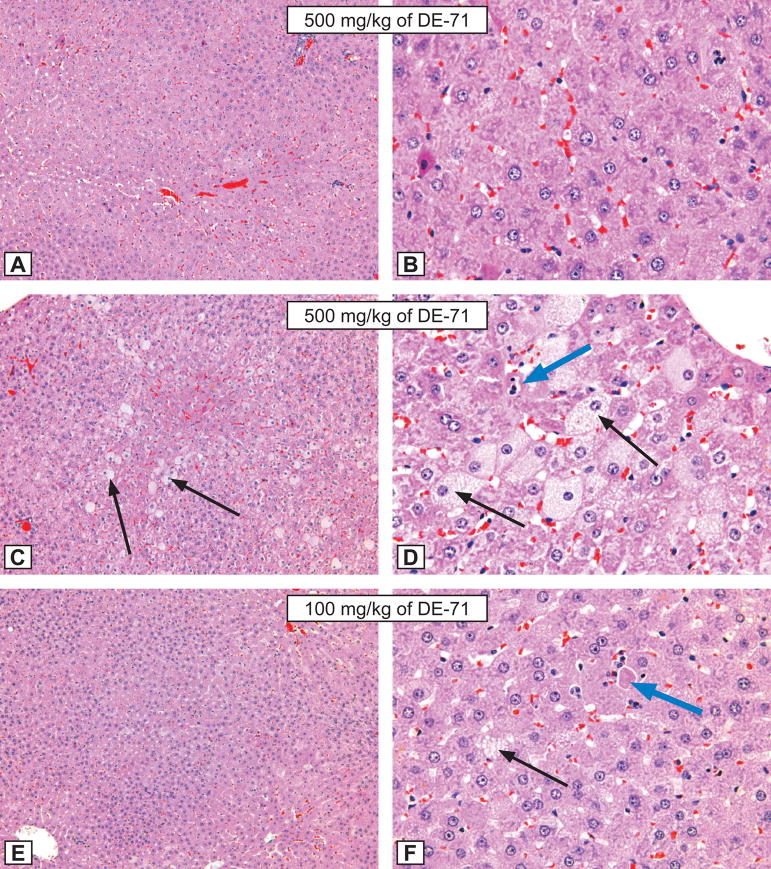
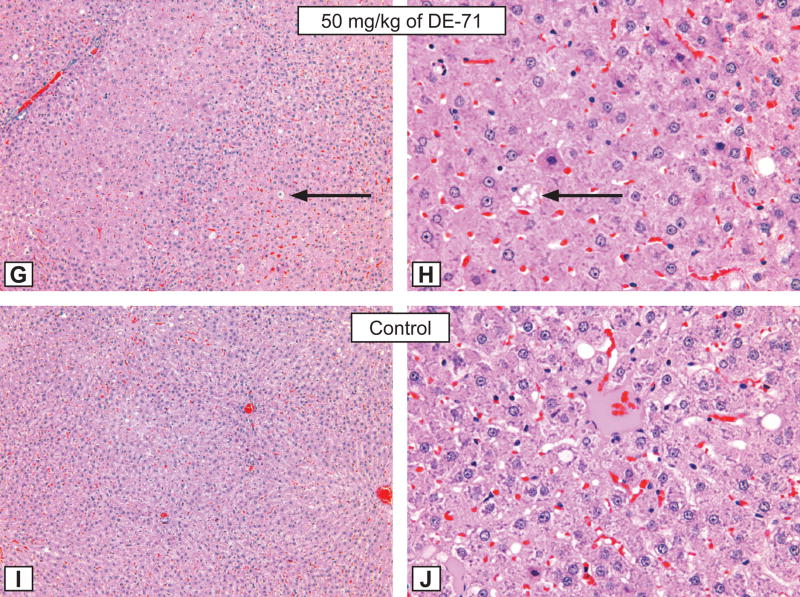
Figure 2. Rat liver lesions.
Figures A and B: Hepatocytic hypertrophy grade 3 in a male rat treated for 3 months by gavage with 500 mg/kg of DE-71. A - X12.5; B - X50. Compare with control animal, Figure I and J, respectively. H&E.
Figures C and D: Hepatocytic hypertrophy grade 4 in a male rat treated for 3 months by gavage with 500 mg/kg of DE-71. C - X12.5; D - X50. Note the presence of hepatocytic fatty degeneration (black arrows), and single hepatocytic necrosis (blue arrow). Compare with control animal, Figure I and J, respectively. H&E.
Figures E and F: Hepatocytic hypertrophy grade 3 in a male rat treated for 3 months by gavage with 100 mg/kg of DE-71. E - X12.5; F - X50. Note the presence of hepatocytic fatty degeneration (black arrows), and single hepatocytic necrosis (blue arrow). Compare with control animal, Figure I and J, respectively. H&E.
Figures G and H: Hepatocytic hypertrophy grade 3 in a male rat treated for 3 months by gavage with 50 mg/kg of DE-71. G - X12.5; H - X50. Note the presence of hepatocytic fatty degeneration (black arrows). Compare with control animal, Figure I and J, respectively. H&E.
Figures I and J: The morphological aspect of hepatocytes from a control male rat from the DE-71 study. X 12.5; B - X50. H&E.


