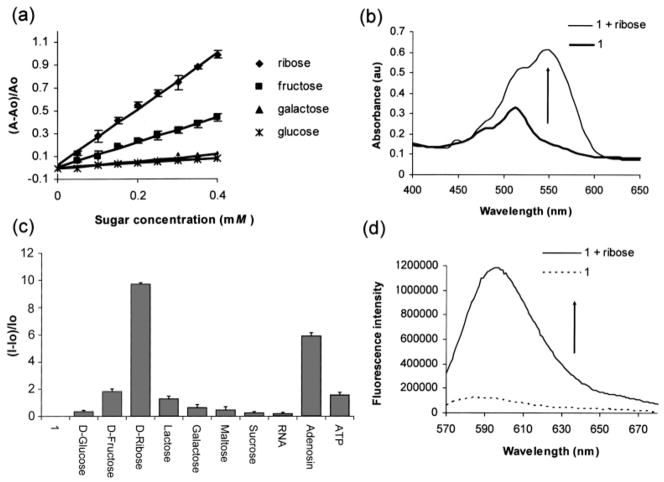
Figure 1.
(a) Relative absorbance changes vs concentration of various monosaccharides in phosphate buffer (0.1 mL, 60 mM, pH 7.4) added to 1 (7.2 × 10⁻⁵ M) in DMSO (0.9 mL) and monitored at 560 nm. (b) The UV–vis spectra of a solution of 1 (7.2 × 10⁻⁵ M) alone and 1 with added ribose (4 × 10⁻⁴ M). (c) Relative fluorescence emission spectra at 597 nm of 1 (4 × 10⁻⁹ M) and saccharides and saccharide-containing molecules (1.85 × 10⁻³ M) in 9:1 DMSO/phosphate buffer (0.05 M, pH 7.4) excited at 565 nm. (d) Fluorescence emission spectra of a solution of 1 (4 × 10⁻⁹ M) and 1 with added ribose (1.85 × 10⁻³ M) in 9:1 DMSO/phosphate buffer (0.05 M, pH 7.4) excited at 565 nm.

