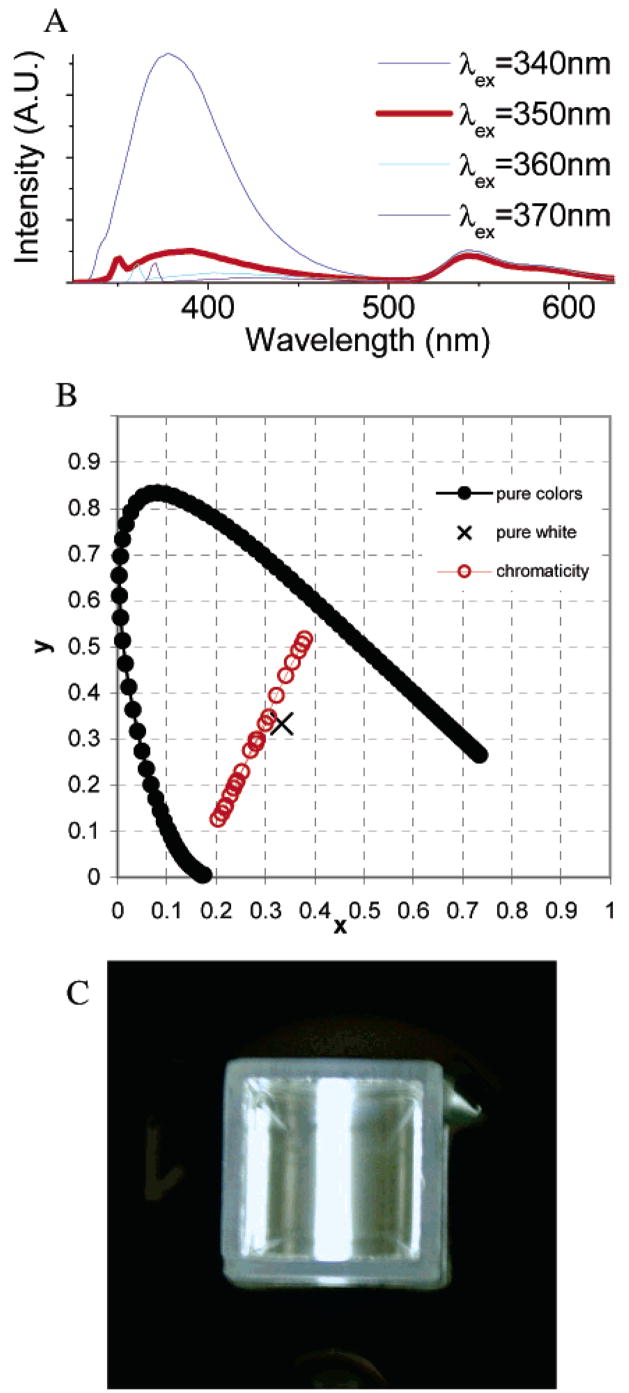
Figure 12.
(A) The emission of 50 μM 12 in MeOH. When excited at 350 nm, 12 shows two emission bands of approximately equal intensity. (B) Shown are the chromaticity coordinates for emission spectra collected with excitation wavelength between 275 and 375 nm plotted in a 1931 CIE chromaticity diagram for a solution of 50 μM 12 in MeOH. (C) Photograph of white light of compound 12 in MeOH.

