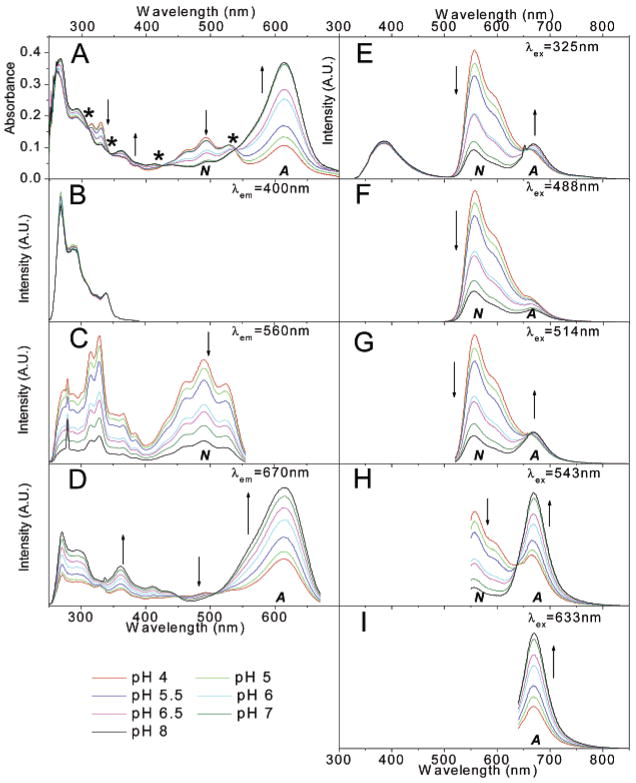
Figure 7.
Spectral properties of 30 μM SNAFR-1 in DMSO with 0.25% phosphate buffer (50 mM) at various pH values. The trend of spectral changes is indicated by arrows as the pH increases from 4 to 8. A = anionic form; N = neutral form. (A) Absorption spectra is shown; the * in panel A indicates the positions of isosbestic points in absorbance spectra. (B–D) Excitation spectra with emission monitored at 400, 560, and 670 nm, respectively, is shown. (E–I) Data are emission spectra excited at 325, 488, 514, 543, and 633 nm, respectively, corresponding to common laser lines. All fluorescence spectra are normalized to the maximum of each data set.

