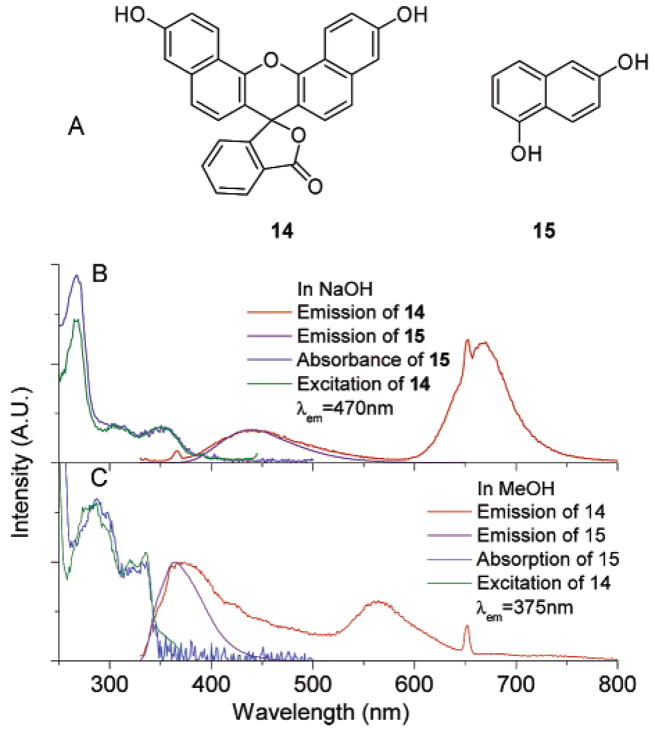
Figure 9.
(A) Structures of compound 14 and 15; (B) emission spectra of 14 and 15 excited at 325 nm, excitation spectrum of 14 with emission monitored at 470 nm; absorption spectrum of 15; all compounds in 0.1 M NaOH; (C) emission spectra of 14 and 15 excited at 325 nm; excitation spectrum of 14 with emission monitored at 375 nm; absorption spectrum of 15. The concentrations of 14 in both solution are 10 μM. All the other solutions are 30 μM. All spectra are normalized to allow comparison.

