Figure 1.
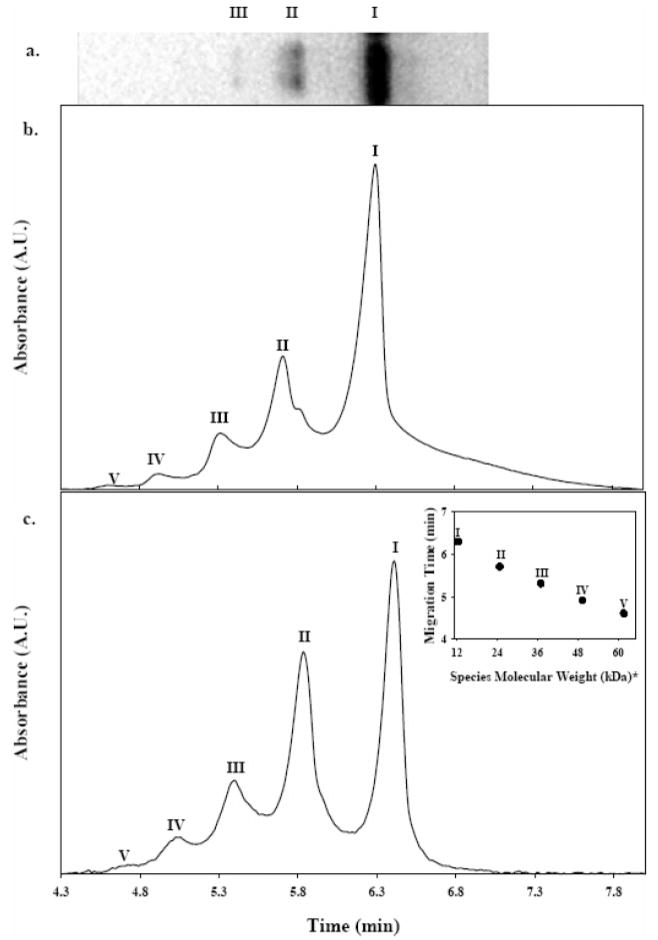
Representative electrophoretic separations of the model oligomeric protein mixture. (a) Black and white photograph of coomasie blue-stained SDS-PAGE minislab gel after separation shows three bands corresponding to monomeric, dimeric, and trimeric cyt c species, (b) electropherogram of nondenatured protein reaction mixture separation monitored at 200 nm showing five distinct components corresponding to monomeric and oligomeric species (I–V), and (c) electropherogram obtained for the separation of a thermally denatured sample showing improved peak shapes. Plot of electrophoretic migration time versus species molecular weight typically obtained for protein mixture separations (inset). The x-axis was generated based on integer multiples of the molecular weight for monomeric bovine cyt c as reported by the manufacturer. Roman numerals (I–V) indicate monomeric, dimeric, trimeric, tetrameric, and pentameric species, respectively.

