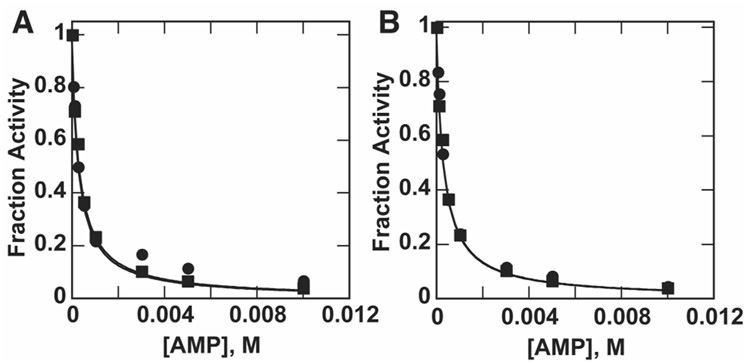
Figure 3.
(A) Inhibition of pNPPS hydrolysis (circles) and MepNPP hydrolysis (squares) by AMP at pH 8.0. Ki values obtained from curve fitting are 294 ± 41 µM (pNPPS) and 318 ± 24 µM (MepNPP). Fitted curves overlap and thus appear as one curve. (B) Inhibition of MepNPPS hydrolysis (circles) and MepNPP hydrolysis (squares) by AMP at pH 8.0. Ki values obtained from curve fitting are 307 ± 17 µM (MepNPPS) and 318 ± 24 µM (MepNPP). Fitted curves overlap and thus appear as one curve. Fraction activity was determined by normalizing the measured rates to the uninhibited rate constant. Note that the Ki value for AMP inhibition is different at pH 8.0 than at 6.5, the pH used in Figure 2 (see text).

