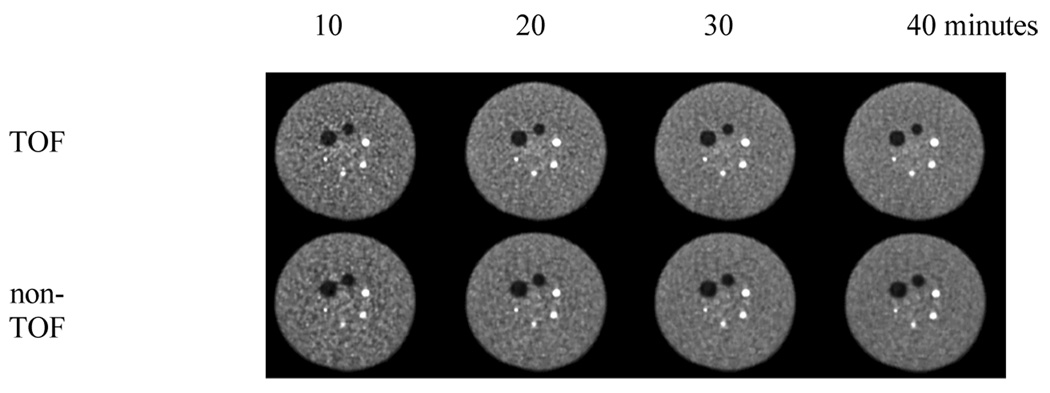
Figure 4.
Central slices from reconstructed images of the 35-cm lesion phantoms. The top row contains images from TOF reconstruction while the bottom row has the non-TOF reconstruction images. In moving left to right, the images represent scan times of 10, 20, 30, and 40 minutes. All images are after 20 iterations and 20 subsets.

