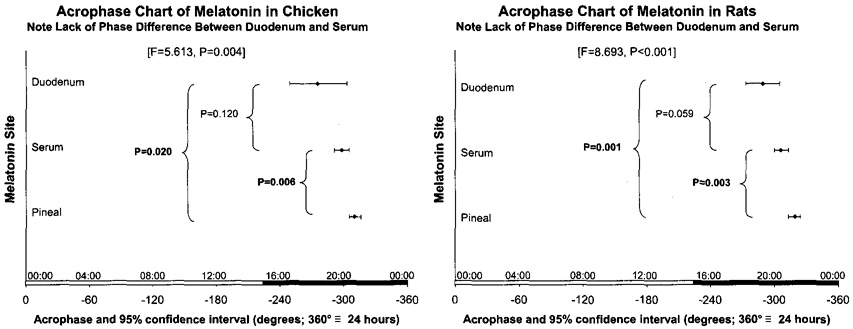
Fig. 2.
Acrophase chart shows results of parameter tests revealing a statistically significant lead in phase of a melatonin rhythm in the gut vs. that in the pineal, in chickens (P = 0.020) and in rats (P = 0.001). The multiple spectral components resolved, given with each figure, aim to quantify the waveform. © Halberg.

