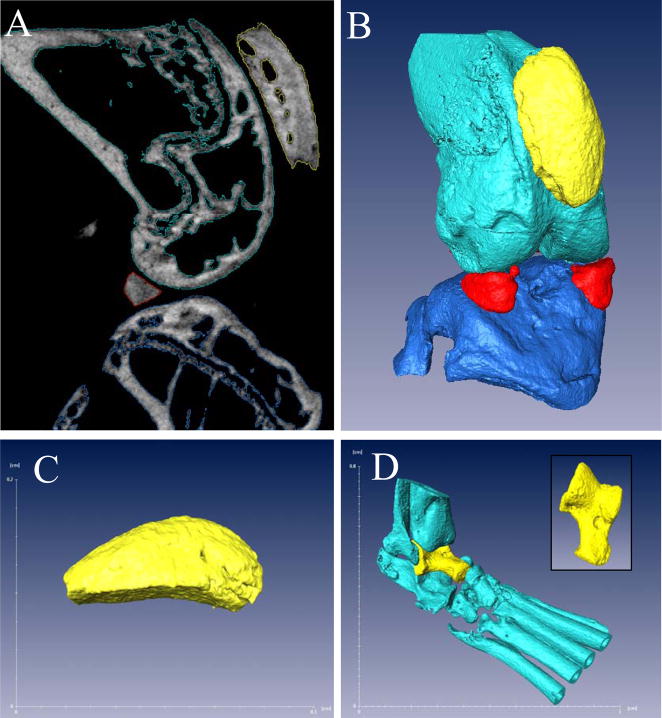
Figure 2. 3D reconstruction and quantification of bone volume from micro-CT.
A representative sagittal slice from a micro-CT scan of a wild type knee is shown to demonstrate the density-based segmentation that is performed on the bone to generate labels for patella (yellow), femur (light blue), tibia (dark blue) and menisci (red), as described in Materials and Methods (A). These labels are then used to reconstruct the bones in 3D (B). The patella (C), due to its ease of reconstruction and proximity to synovitis, is used as a quantification of bone volume at the knee joint. The ankle joint (D) is reconstructed in a similar manner as the knee with the talus (yellow and inset) as measure of bone volume in this joint.

