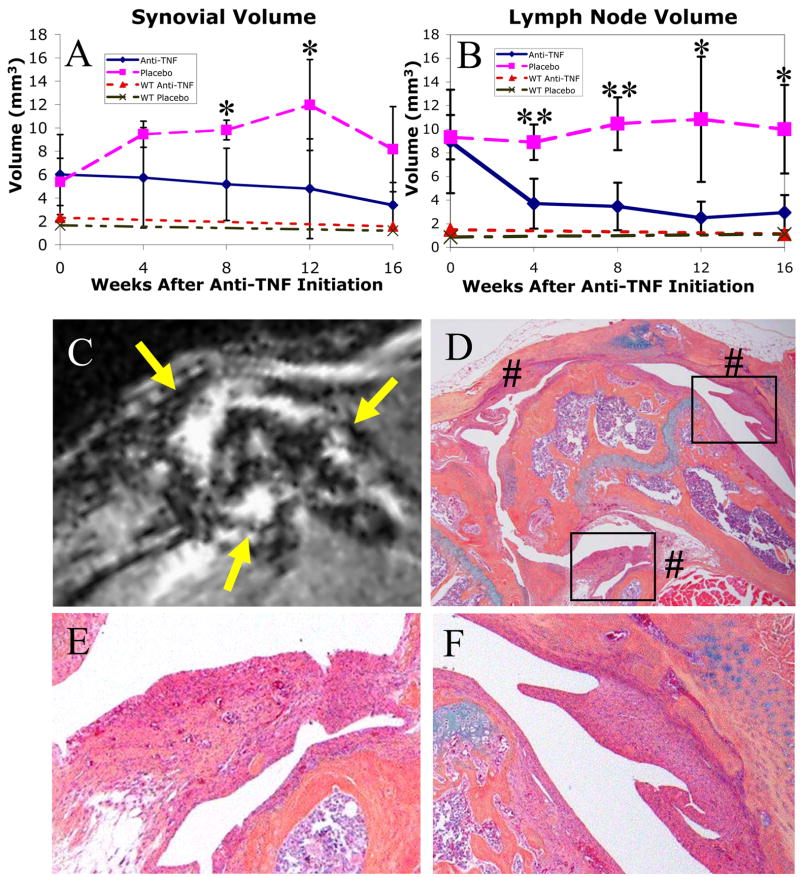
Figure 4. Effects of anti-TNF therapy in 5–6 month-old WT and TNF-Tg mice.
WT and TNF-Tg mice were MR imaged at baseline and were randomized into anti-TNF and placebo treatment groups (n=4 per group) at 5–6 months of age. TNF-Tg mice were scanned every 4 weeks thereafter. WT mice received a further follow-up MRI 16-weeks after treatment. The synovial (A) and LN (B) volumes for each scan were calculated, and the data from the TNF-Tg placebo (pink long-dashed) vs. anti-TNF (blue solid) groups, and WT placebo (green intermittent-dashed) vs. anti-TNF (red short-dashed) groups, are plotted as the mean +/− standard deviation. Anti-TNF treatment had no effects in WT mice, and no changes in synovial or LN volume were detected in these animals after 16 weeks. In contrast, two-sided t-tests revealed significant (*, p<0.05) and highly significant (**, p<0.01) differences between anti-TNF vs. placebo TNF-Tg groups of the same time point after therapy. Linear mixed-effects regression analysis revealed a highly significant difference in slopes for anti-TNF versus placebo in both synovial volume (p<0.01) and LN volume (p<0.001). The linear progression of inflammatory arthritis (note decrease in synovial volume from 12 to 16 weeks in placebo group) was limited by tissue fibrosis, as shown by non-enhancing synovial regions on MRI (C, yellow arrows) and corresponding 40X histology (D, indicated by #) of a representative placebo TNF-Tg mouse. The degeneration of the pannus in the end-stage of arthritis in this animal is further illustrated by the decreased cellularity of the synovium (boxes in D) shown at 200X (E and F).

