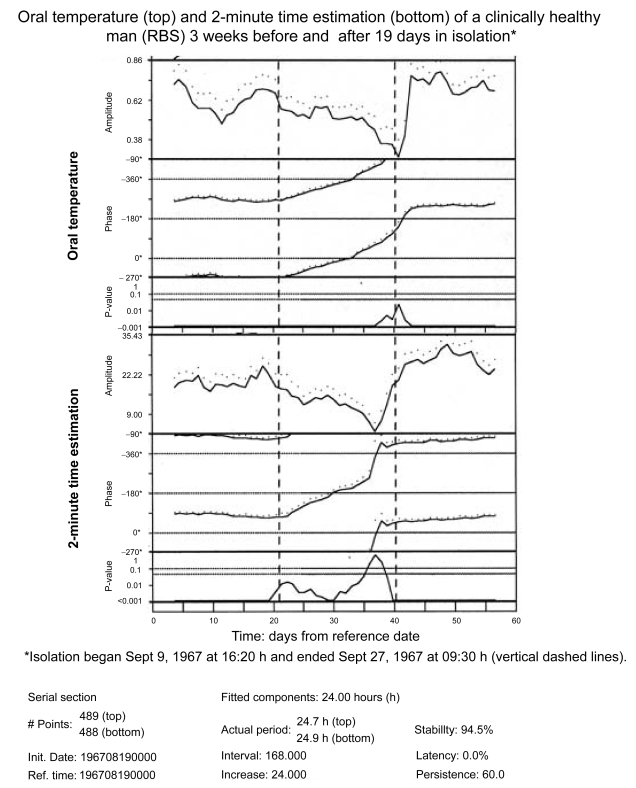
Figure 2C.
Chronomic serial sections of oral temperature and 2-minute estimations show time courses during isolation (as compared to before and after isolation) of a gradually decreasing amplitude and a delaying phase. The delaying phase corresponds to a lengthened period. The interval used for analysis (of 168 hours) involves, before and after the transitions, the use of some data from before and after isolation and shows, for time estimation but not for oral temperature, a spurious anticipatory amplitude rise before the end of the isolation span.

