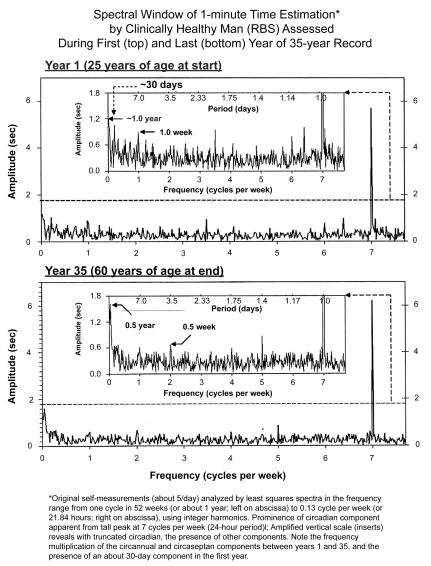
Figure 3.
The large amplitude of the 24-hour synchronized circadian component dominates the spectrum of the estimation of 1 minute by RBS, a clinically healthy man at both 25 (top) and 60 years of age (bottom), as visualized by the abscissa at the bottom, showing cycles per week, with 7 cycles = 1 day, a very sharp peak at each age. In the inserts of each half, the period is also given. The 24-hour synchronized component stands out clearly, as it does in other cases under conditions of ordinary life (see also Figure 2b’s spectrum), as well as in isolation from society in caves, albeit with a much lesser amplitude, Figure 2b.

