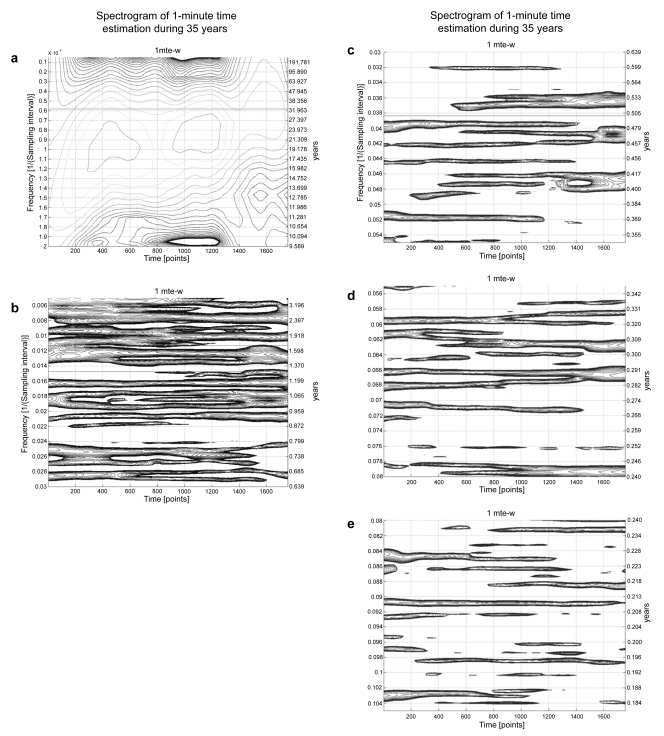
Figure 5.
Spectrograms of 1-minute estimations around the clock for 35 years, with time (35 years) on the abscissa and frequency on the ordinate. 5a shows a very prominent about (~) 10-year period, an ~21-year or even longer period, with changes in its location along the frequency ordinate from the first ~17.5 years in the left half of the graph, to the next ~17.5 years in the right half of the figure. Figures 5b and in particular 5c and 5d visualize the aeolian character of the spectral components. Many of them are intermittent, changing in frequency and amplitude when present, a fleeting, nonstationary behavior. Whether the failure to detect a component at a given time is due to its absence or to its being buried in noise cannot be decided.

