Figure 1.
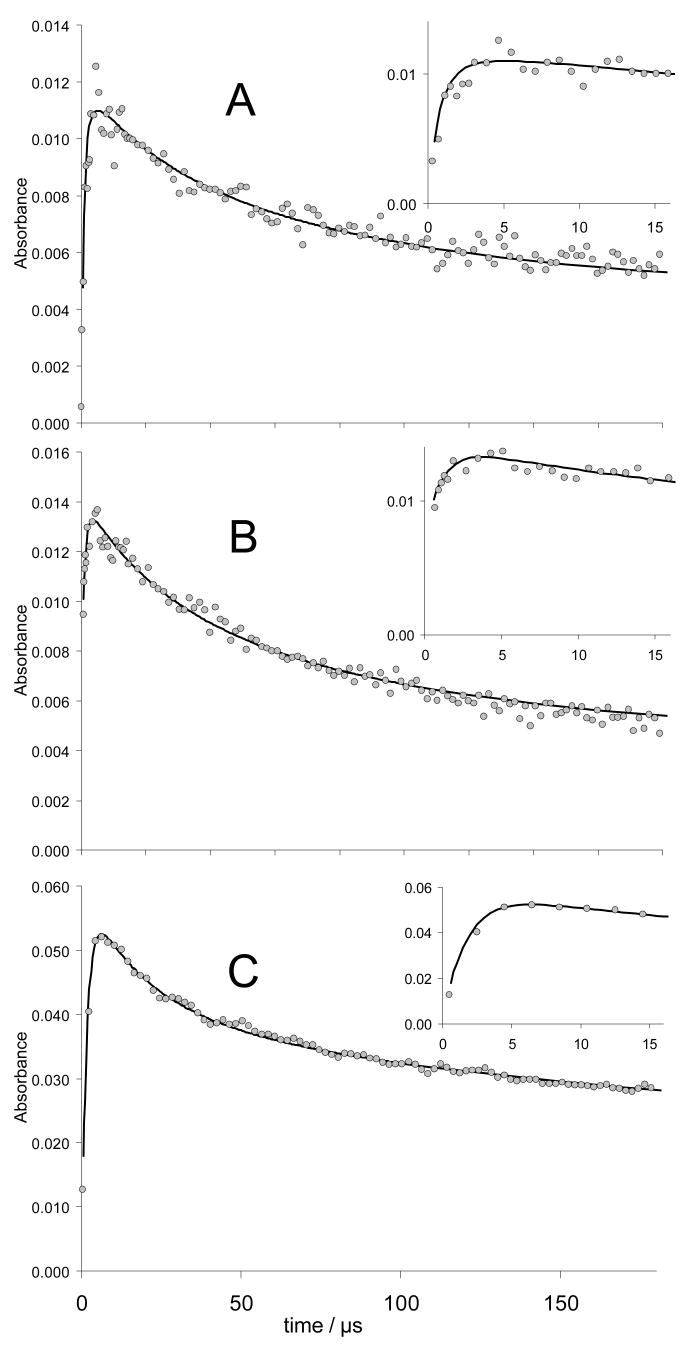
Pulse radiolysis of N2O saturated aqueous solutions of 200 μM N-Ac-CysGly6 (Panel A, 18 Gy), 600 μM N-Ac-CysGly6 (Panel B, 20 Gy) and 720 μM Gly6 (Panel C, 15 Gy, control). The experimental traces (dots) are averaged points for specific time periods in order to improve legibility. They are compared with simulations using an identical parameter set. The time-resolved absorption traces in Panels A and B were detected at 260 nm, the one of Panel C at 265 nm. The solutions of N-Ac-CysGly6 contained 10 mM phosphate (pH 4) the one of Gly6 5 mM H2SO4.
Although traces A and B start at different absorption levels, which is due to the reactions of the primary radicals with different concentrations of N-Ac-CysGly6, they reach their maximum at the same time. This indicates a rate determinig step which is 1st order, i.e. intramolecular.

