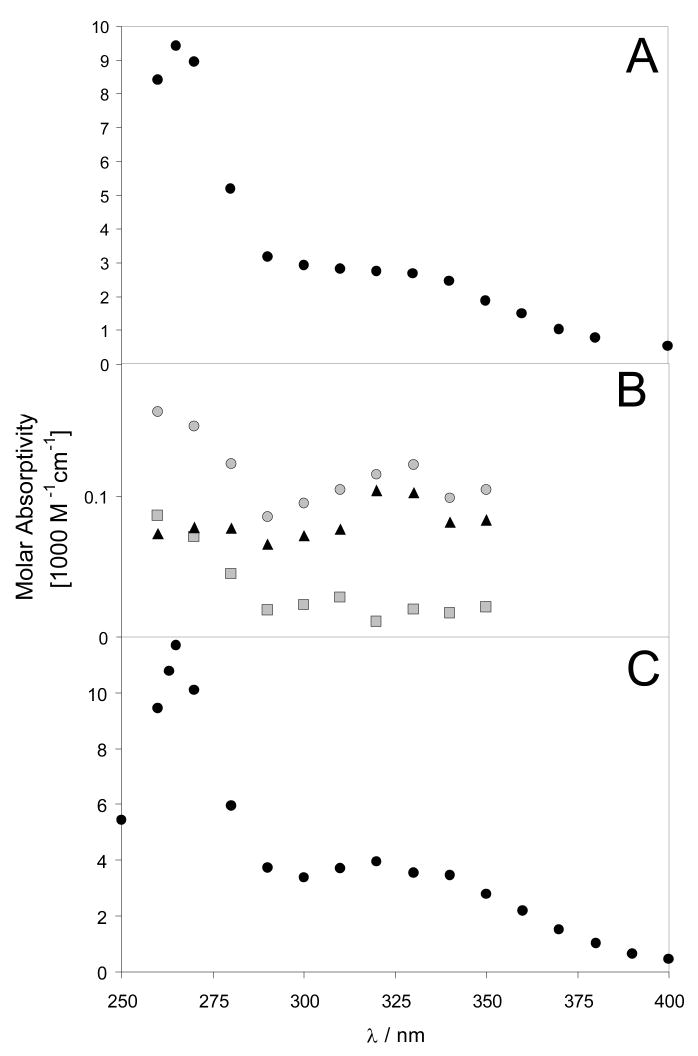
Figure 2.
Spectra of (Gly6)• (Panel A), N-Ac-CysS•-OMe (Panel B, black triangles) and N-Ac-Ala•-NH2 (Panel C). Experimental conditions were: Panel A: 1 mM Gly6, 9 mM H2SO4, N2O-sat., G(•OH) = 3.6. Panel B: The spectrum of the cysteinyl thiyl radical was derived by a subtraction of a mixed spectrum of thiyl radical and t-butanol radicals (grey circles) and a pure t-butanol radical spectrum (grey squares). The t-butanol spectrum was measured in an argon-saturated solution of 90 mM t-butanol and 90 mM H2SO4. For the mixed spectrum 0.35 mM N-acetylcysteinemethylester (N-Ac-Cys-OMe) was added. G(H•) = 3.1. Panel C: 10 mM N-Ac-Ala-NH2, 50 Gy, N2O-sat., 50 Gy

