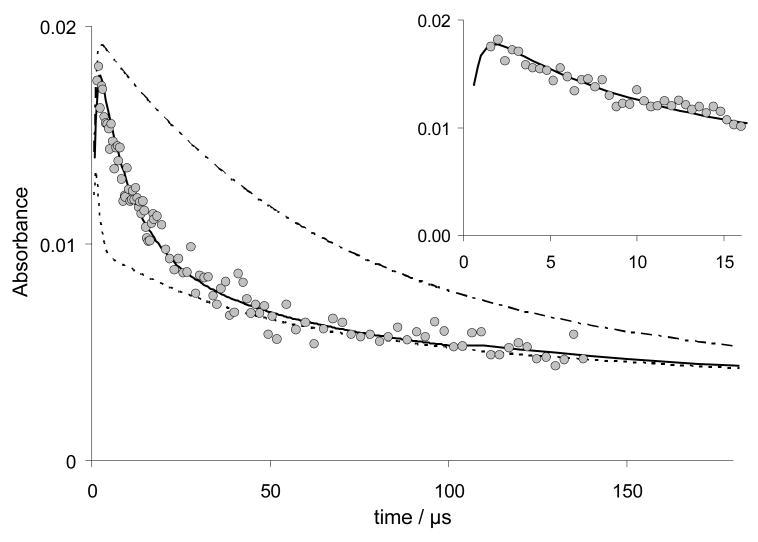
Figure 3.
Pulse radiolysis (20.8 Gy) of 200 μM N-Ac-AlaAlaAspAlaAlaAla, pH 4, N2O sat. The reaction was followed at 260 nm (circles). The absorption after 50 μs is indicative for K14, in the time range 5 – 30 μs the kinetics are governed by the installation of equilibrium 14 (i.e. k14 + k-14). To visualize the sensitivity of the simulation on k14 results for k14 = 8×10⁵ s-1 (too fast, dotted line), k14 = 1×10⁵ s-1 (correct value, full line) and k14 = 2×10⁴ s-1 (too slow, dashed line) for the given K14 are shown.

