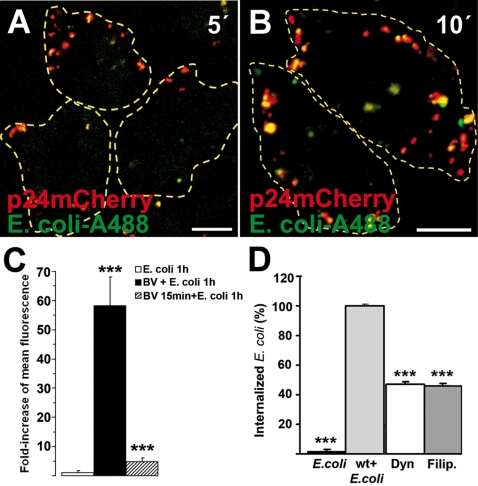
Figure 6. Phagocytosis-like uptake of baculovirus.
(A,B) Baculovirus (p24mCherry, MOI 200; red) internalized together with A488-labeled E. coli bioparticles (green) in HepG2 cells at 5 (A) and 10 min (B) p.t. Scale bars, 10 µm. (C) Induction of phagocytic uptake of E. coli during baculovirus transduction. Fluorescent E. coli were fed simultaneously with baculovirus (MOI 200; baculovirus +E. coli) into cells and fixed at 60 min p.t. As a control, E. coli particles were fed into cells without baculovirus (E. coli) or after virus transduction for 15 min (baculovirus 15′+E. coli). To separate the fluorescence of internalized and non-internalized particles, the cells were treated with trypan blue. Normalized mean fluorescence values (Ctrl = 1) and standard deviation from 250–300 cells are shown. Fluorescence intensity was measured from confocal microscopy images (see Materials and Methods). (D) Dynasore and filipin were tested for their effects on stimulated E. coli uptake during baculovirus transduction. Co-internalization of baculovirus and E. Coli for 1 h without drugs was set to 100%. Fluorescence intensitites were calculated from three separate experiments (30–40 cells) using segmentation tools embedded in the BioimageXD software. Dyn (dynasore, 80 µM) and Filip. (filipin, 1 µg/ml) were added 30 min before the experiment and they were present during the whole internalization assay. Statistical significance was determined by using the unpaired Student's t test with a two-tailed P value, ***P<0.001.

