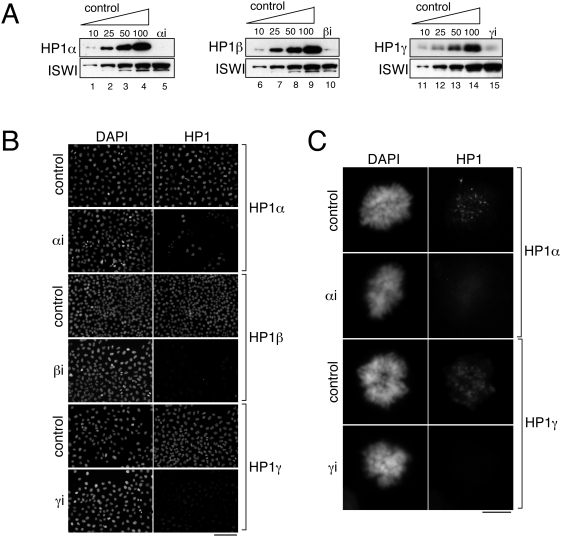
Figure 3. Knock down of HP1 proteins by siRNA in HeLa cells.
(A) Extracts made from HeLa cells transfected with siRNAs specific to HP1alpha (lane 5), HP1beta (lane 10) or HP1gamma (lane 15) were analyzed by immunoblotting. To estimate the extent of the depletion of the corresponding isoform, increasing amounts of a control cell extract were loaded on the same gel (lanes 1–4, 5–9 and 11–14). The levels of the chromatin remodeller ISWI were analyzed as a loading control. (B&C) HeLa cells transfected as in A were analyzed by immunofluorescence with the indicated antibodies (green) and counterstained with DAPI (blue). In B, cells were not pre-extracted before fixation. In C, cells were pre-extracted before fixation to detect only the chromatin-bound population. Representative examples of mitotic cells are shown. Scale bars: 50 micrometers in B and 5 micrometers in C.

