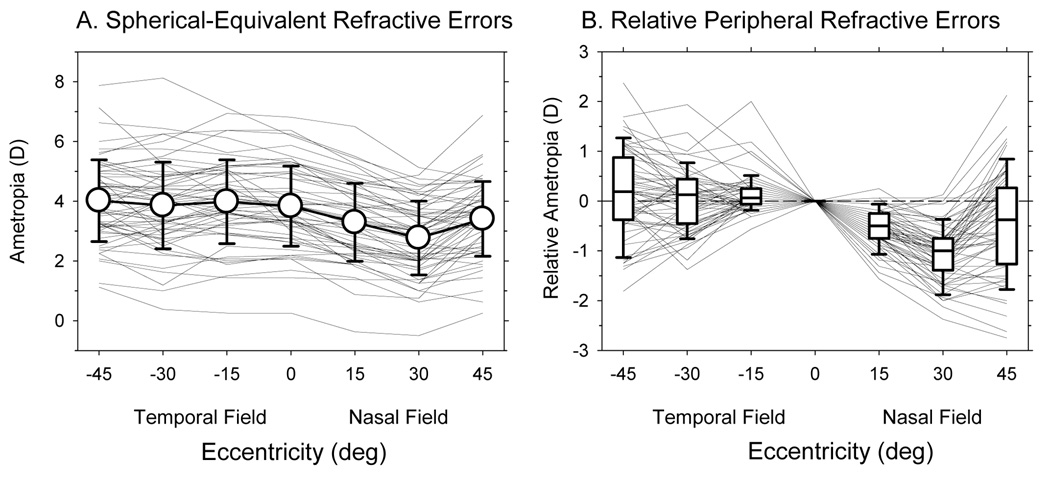
Figure 1.
A. Spherical-equivalent refractive errors plotted as a function of horizontal eccentricity. Thin solid lines represent the right eyes of individual monkeys. The open circles represent the averages (± SD) for all 58 monkeys. B. The peripheral refractions of individual monkeys normalized to their central refractive errors plotted as a function of horizontal eccentricity. Thin solid lines represent individual monkeys. The lines in the box plots represent the medians. The boundaries of the box plots indicate the 25th and the 75th percentiles. The error bars above and below the boxes indicate the 90th and 10th percentiles, respectively.

