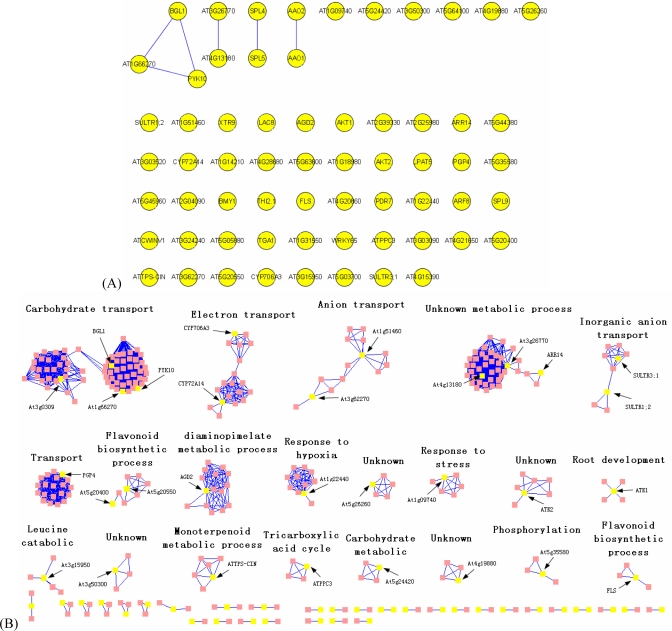
Figure 2.
Network analysis of the Arabidopsis interactome showing direct interactions between co-expressed gene products and their first neighbors. (A) Direct interactions between correlated gene products. (B) Direct interactions between correlated gene products and their first neighbors. Some sub-networks show enrichment in GO terms (functional modules). Arrows indicate the SPL-correlated gene nodes present in these functional modules.

