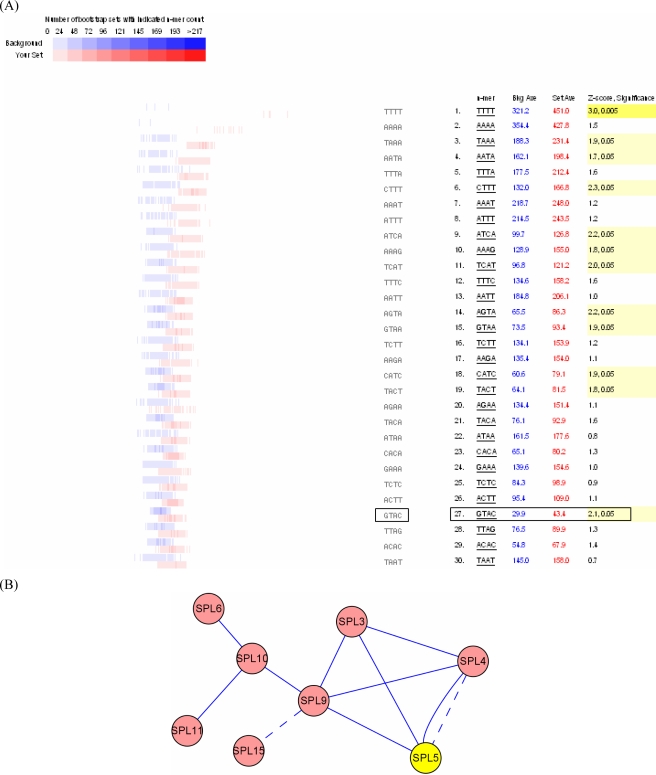
Figure 5.
Promoter and network analysis of SPL genes. (A) The distribution of the occurrence of the GTAC motif in 1000 sets of SPL genes promoters randomly selected from the Arabidopsis genome. Distribution in 1,000 randomly generated promoter sets: Average 29.7. Distribution in 1,000 bootstraps of our promoter set: Average 42.9. Z-score, Significance: 2.2,0.05. (B) A putative network of SPL genes (a solid line indicates co-expression, and a dashed line indicates protein interactions).

