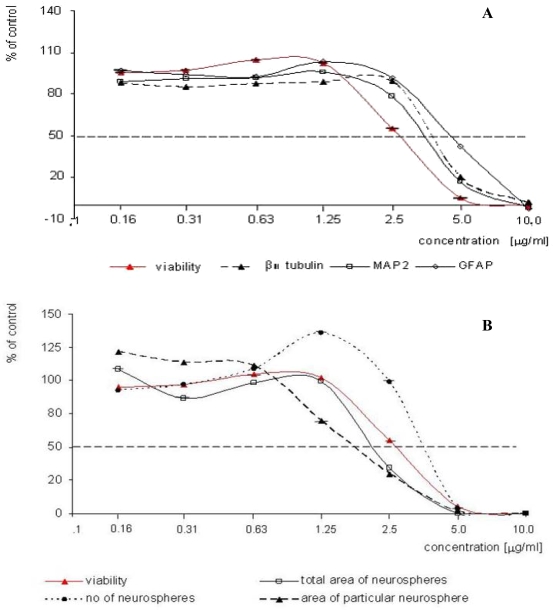
Figure 2.
Representative concentration-response curves illustrating an effect of ochratoxin A on cytotoxicity (NRU test) and differentiation (six different endpoints) in micromass embryo midbrain cells cultured in vitro. The cytotoxic concentration of 2.5 μg/mL, mentioned in Table 1, resulted in increasing the number of neurospheres and decreasing of their area (B).

