
Figure 1.
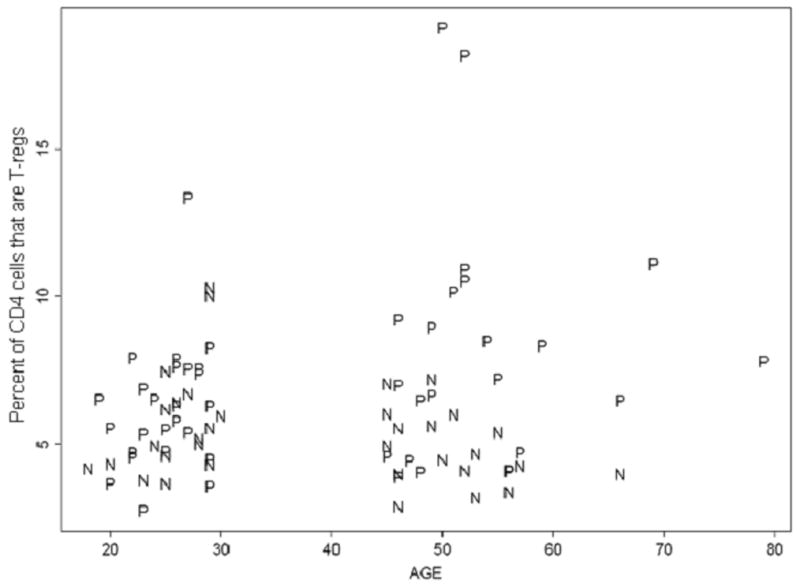
Plot of age versus the total T-reg percent. Total T-reg percentage is defined as the percentage of CD4+ T-cells that are CD25+CD127lo. P represents HIV+ subjects while N represents HIV− subjects.
Official websites use .gov
A
.gov website belongs to an official
government organization in the United States.
Secure .gov websites use HTTPS
A lock (
) or https:// means you've safely
connected to the .gov website. Share sensitive
information only on official, secure websites.
Plot of age versus the total T-reg percent. Total T-reg percentage is defined as the percentage of CD4+ T-cells that are CD25+CD127lo. P represents HIV+ subjects while N represents HIV− subjects.