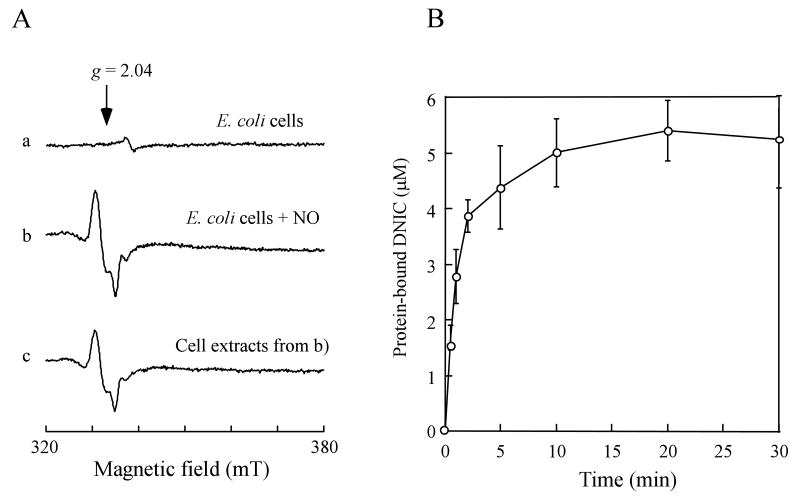
Figure 3. Formation of the protein-bound DNICs in E. coli cells by NO.
A), formation of the protein-bound DNICs in E. coli cells by NO. E. coli cells were exposed to pure NO gas at a rate of 100 nM per second for 0 min (spectrum a) and 10 min (spectrum b) using the Silastic tubing NO delivery system under anaerobic conditions. The E. coli cells were concentrated to O. D. at 600 nm of 10.0 after the NO exposure. Spectrum c), the cell extracts prepared from the NO-exposed E. coli cells. B), kinetics of the protein-bound DNICs formation in E. coli cells by NO. The amplitudes of the EPR signal at g = 2.04 in E. coli cells were plotted as a function of the NO exposure time. The endonuclease III-bound DNIC was used as a standard. The data in B) were the averages from three independent experiments.

