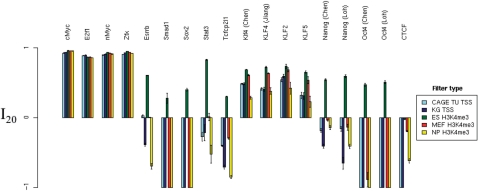
Figure 5.
Filter performance in mouse ES cells at sensitivity 20%. The best relative FP rate (as defined in the Methods section) of each filter type has been plotted for the 18 mouse gold-standard TFBS datasets. Multiple gold-standard datasets were available for Klf4, Oct4 and Nanog, and the first author of the corresponding gold-standard dataset has been indicated. PhastCons filtering failed to yield a positive relative FP rate improvement for any of the 18 gold-standard datasets at this sensitivity level, and so has been omitted. Error bars indicate standard error. Barplot mean and standard errors smaller than −1 have been truncated to −1, to allow clearer visualization of relative FP improvement values between 0 and 1.

