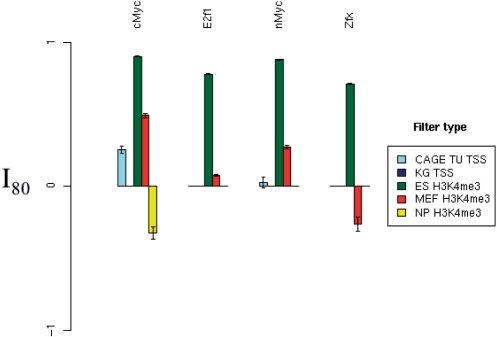
Figure 6.
Filter performance in mouse ES cells at sensitivity 80%. The best relative FP rate (as defined in the Methods section) of each filter type has been plotted for the TFs cMyc, E2F1, nMyc and Zfx. PhastCons filtering failed to yield a positive relative FP rate improvement for any of the four gold-standard datasets at this sensitivity level, and so has been omitted. Error bars indicate standard error. For a given TF and filter, if the filter cannot attain a sensitivity of 80% due to actual positive elimination, then the bar is omitted from the plot.

