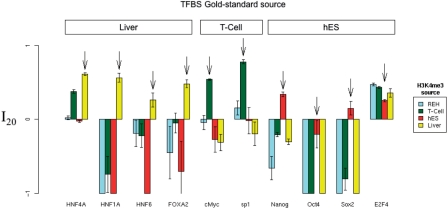
Figure 7.
Tissue specificity of TFBS predictions in three human tissues. The best relative FP rate (as defined in the Methods section) of each H3K4me3 filter is shown for the 10 human gold-standard TFBS datasets. Each arrow indicates the results for the H3K4me3 filter using data estimated from the same tissue as the given TFBS gold-standard data. For example, the distribution of HNF4A TFBSs was estimated in liver, so the arrow points to the liver results for HNF4A. Error bars indicate standard error. Barplot mean and standard errors smaller than −1 have been truncated to −1, to allow clearer visualization of relative FP improvement values between 0 and 1.

