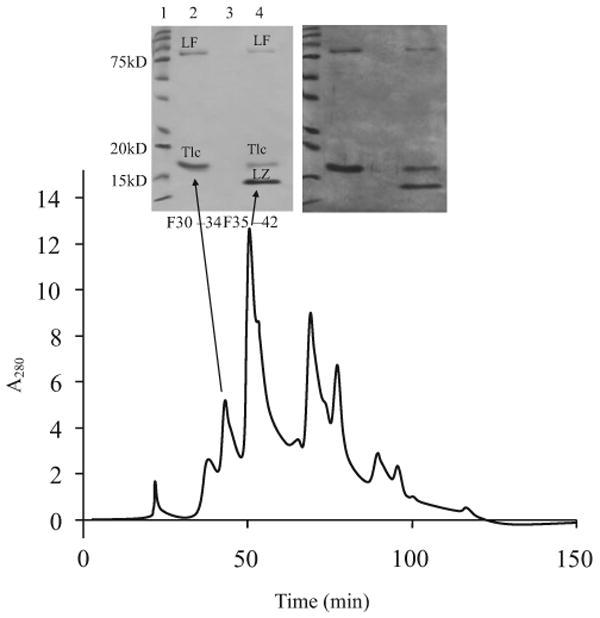
Figure 1.

Elution profile of whole tears from sized exclusion chromatography with corresponding Coomassie blue (left) and silver stained (right) gels of selected pooled 0.5mL fractions. Arrows link the absorbance spectrum and pooled fractions to their lane in the gel. The different bands are lactoferrin (LF), lysozyme (LZ), and tear lipocalin (Tlc).
