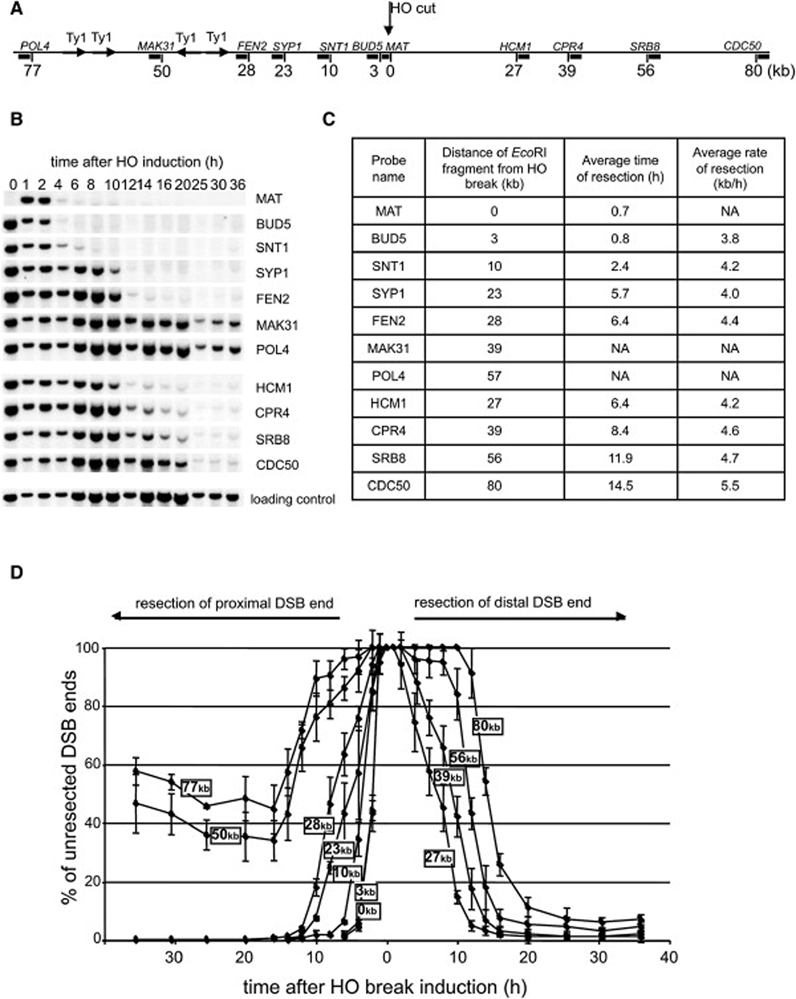
Figure 1. Analysis of 5’ strand resection in wild-type cells.
(A) Position of EcoRI sites and DNA probes used to analyze 5’ strand processing with respect to the HO recognition site on chromosome III. (B) Southern blot analysis of 5’ strand resection in wild-type cells. Names of the probes are indicated. (C) Average rate of resection beyond each studied EcoRI site. NA – not applicable. (D) Plot demonstrating percentage of unprocessed 5’ strand for each studied EcoRI site.

