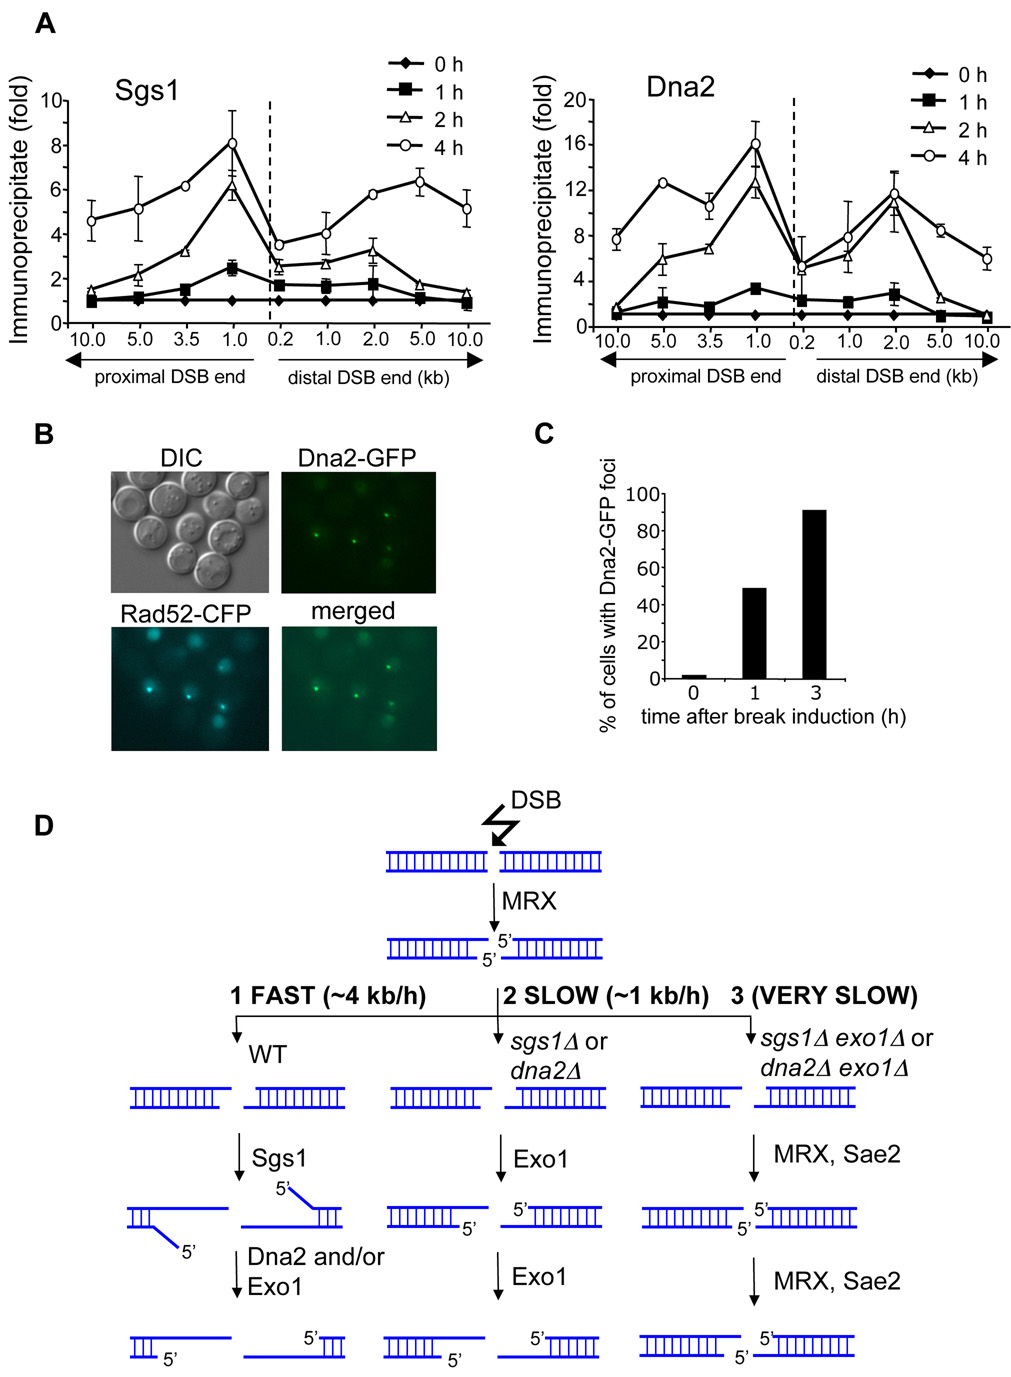
Figure 7. Recruitment of Dna2 and Sgs1 to a DSB and a model of 5’ strand resection at DSBs.
(A) Localization of Sgs1 and Dna2 to DSBs at the MAT locus estimated by ChIP before and 1, 2 and 4 h after break induction. IP represents the ratio of the Sgs1p or Dna2p IP PCR signal before and after HO induction, normalized by the PCR signal of the PRE1 control. A dotted line indicates the location of the HO-induced break. (B) Dna2-GFP foci formed after HO break induction colocalize with Rad52-CFP foci. (C) Number of cells with Dna2-GFP foci before and 1 and 3 h after break induction. (D) Model representing three different 5’ strand resection pathways at a DSB with various processivity.

