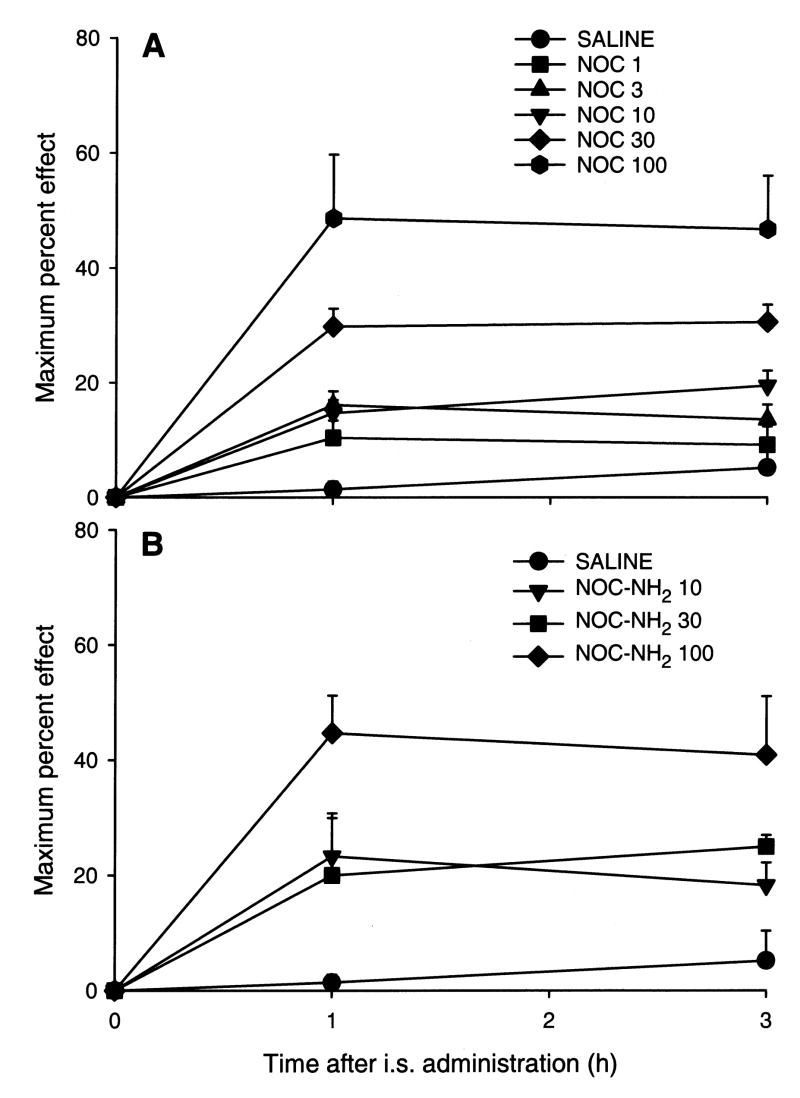
Fig. 1.
Time course of the antinociceptive effect of nociceptin (NOC, panel A) or noiceptin1–13 amide (NOC-NH2, panel B) after spinal administration. Doses were 1–100 nmol/frog for nociceptin and 10–100 nmol/frog for noiceptin1–13 amide. N=6–8 animals per treatment dose and saline-injected controls.

