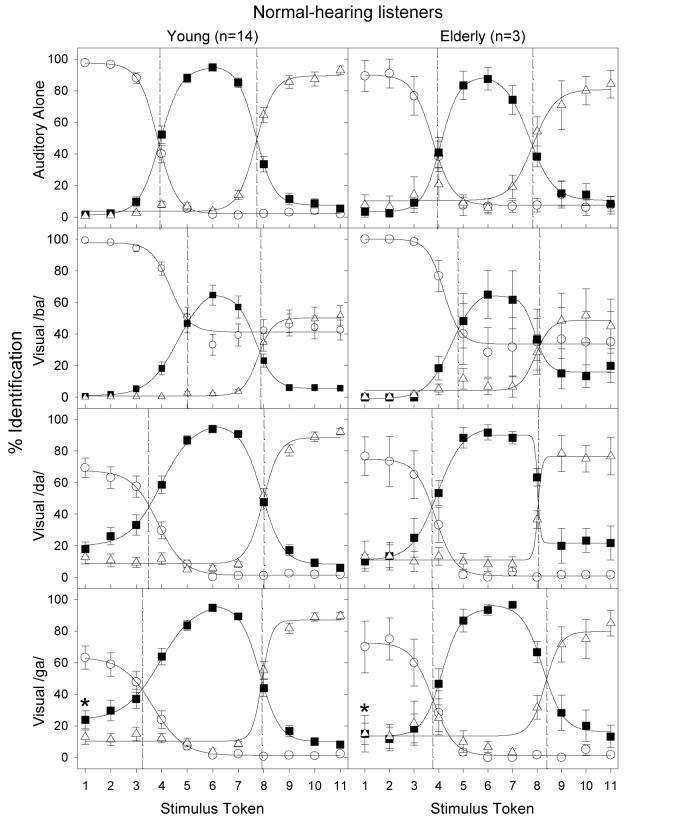
Figure 1.
Percent identification as a function of consonant continua in young (left column) and elderly (right column) normal-hearing listeners. The top panel shows the results for the auditory-alone continuum. The data for the three AV conditions are shown in separate panels (visual /b/: second row; visual /d/: third row; and visual /g/: bottom row). Open circles (○), filled squares (▪), and open triangles (δ) represent the percentage response to /b/, /d/, and /g/, respectively. Error bars represent the standard error of the mean. Sigmoidal 4-parameter functions were fitted to the data to reveal /b/-/d/ and /d/-/g/ boundaries. Vertical dashed lines show where these boundaries occur along the continuum. An asterisk (*) denotes one of the commonly observed McGurk effects, i.e., when subjects responded /da/ when a visual /ga/ face was paired with the reference auditory /ba/ sound (token 1).

