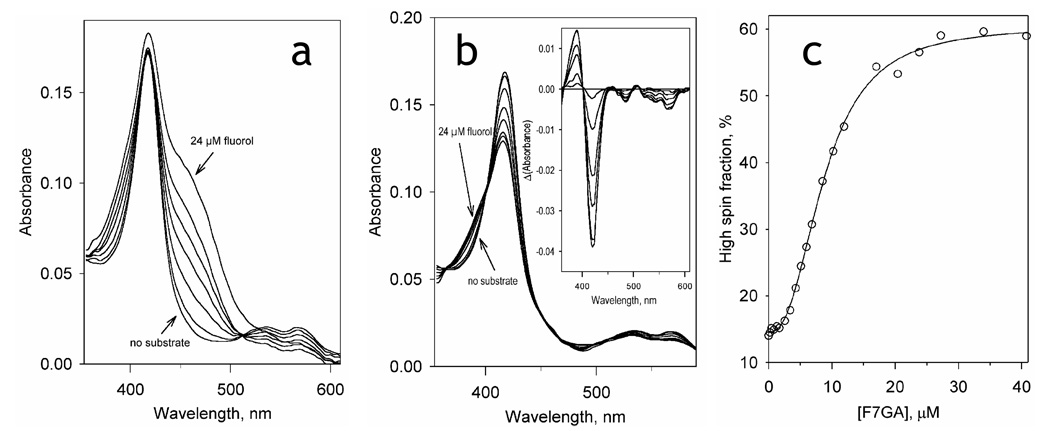
Fig. 2.
Titration of P450eryF (1.8 µM) with Fluorol-7GA. (a) A series of absorbance spectra recorded at increasing concentrations of Fluorol. (b) The same series of spectra with the Fluorol absorbance subtracted. The inset shows the difference spectra. (c) the changes in the P450 spin state. The solid line shows the data fitting by the Hill equation (S50 = 8.7µM, n = 2.3, ΔF(high spin)max= 46%).

