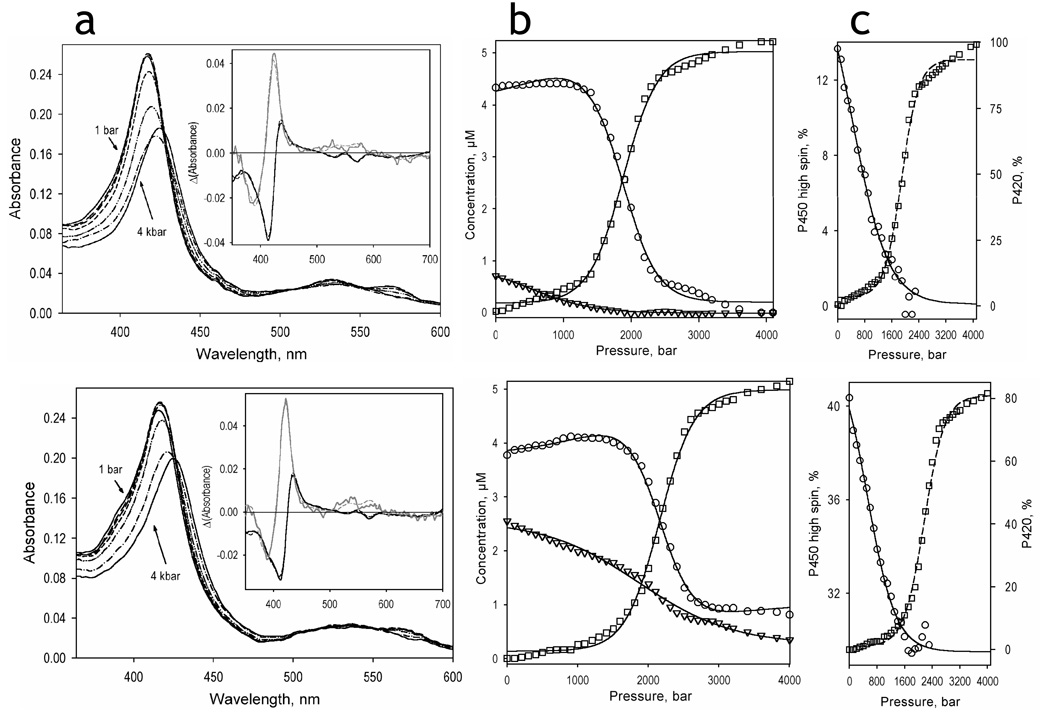
Fig. 4.
Pressure-induced transitions in P450eryF in the absence of ligand (top) and in the presence of 50 µM Fluorol (bottom). Panels a shows the series of spectra obtained at 1 bar (solid lines), 800 bar (long dash), 1200 bar (medium dash), 1600 bar (short dash), 2000 bar (dash-double-dot), 2400 bar (dash-dot), and 4000 bar (solid lines). Insets show the spectra of the first (black) and second (gray) principal components obtained by the application of PCA to the corresponding difference spectra. The spectra are normalized to represent the transitions in 1 µM protein. Dashed lines represent the approximations of the principal component spectra by combinations of the spectral standards of the low-spin, high-spin and P420-states of P450eryF. Panels b show the corresponding changes in the concentration of the high-spin (triangles), low-spin (circles), and P420 (squares) states of P450eryF. The pressure-induced changes in the high-spin fraction of the P450 state of the enzyme (circles, solid line) and in the fraction of the P420 state of the enzyme (squares, dashed line) are illustrated in panels c.

