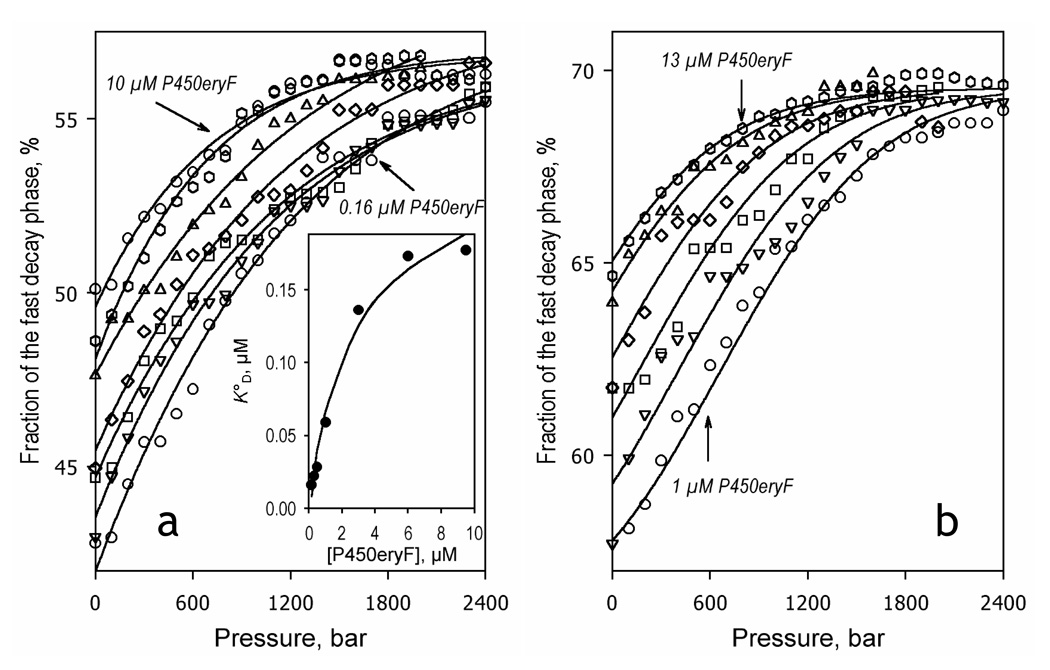
Fig. 7.
Effect of hydrostatic pressure on the interactions of P450eryF with Fluorol-7GA monitored by lifetime FRET at a 1:1 (left) and 1:3 (right) enzyme:substrate ratio. The dependencies of the relative amplitude of the fast decay phase on hydrostatic pressure are shown for 3, 0.5, 0.32 and 0.16 µM and for 9.6, 5.5, 3.3 and 1.8 µM enzyme concentrations for the left and right panels, respectively. Solid lines in panel a show the results of the fitting of the pressure dependencies (taken individually) to the equation for the equilibrium of binary association with pressure-dependent KD. The inset in this panel shows the concentration dependence of the resulting value of KD°. Lines in panel b represent the results of global fitting of the whole dataset to the same equation.

