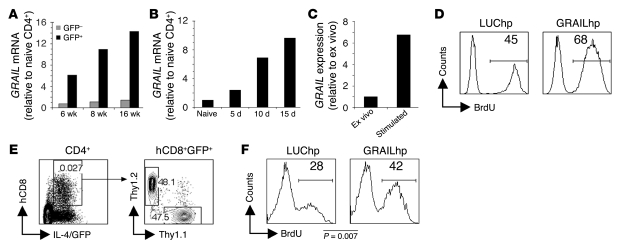
Figure 5. Increased GRAIL underlies Th2 cell hyporesponsiveness.
(A) At 6, 8, and 16 wk after infection, GFP+CD4+ and GFP–CD4+ cells from S. mansoni–infected and CD4+ cells from uninfected 4get mice were analyzed by real-time RT-PCR for GRAIL mRNA. (B) At 5, 10, and 15 d after initiation of egg injections (described in Figure 2), draining LN GFP+CD4+ cells from infected mice and CD4+ cells from naive control 4get mice were analyzed by real-time RT-PCR for GRAIL mRNA. (C) GFP+CD4+ cells from acutely infected mice were analyzed by real-time RT-PCR for GRAIL expression ex vivo or after 8 d in vitro incubation with SEA-pulsed DCs. (D) GFP+CD4+ cells from 8 wk infected mice were infected with GRAILhp or LUChp prior to 8 d stimulation with SEA-pulsed DCs. After stimulation, sorted hCD8+ cells were restimulated for 72 h with SEA-pulsed DCs. In vitro proliferation was assessed using flow cytometry to determine the incorporation of BrdU during the 72-h culture. Numbers within histograms indicate mean percent BrdU+ cells. (E and F) GFP+CD4+ cells from 4get Thy1.2 or 4get Thy1.1 mice 5 d after initiation of egg injections were infected with retrovirus prior to 1-d stimulation with SEA-pulsed DCs. Cells were then mixed and transferred into infected Balb/c mice. (E) Gating strategy used to detect hp-expressing cells in recipient animals. Numbers within plots represent the frequency of the cells within the gate. (F) BrdU incorporation into Thy1.1+ (GRAILhp) and Thy1.2+ (LUChp) CD4+IL-4/GFP+hCD8+ cells was analyzed on day 11, after a 3-d BrdU labeling period. Shown are concatenated data from all mice within the experiment (4–5 mice per group). Numbers within histograms represent mean percent BrdU+ cells.

