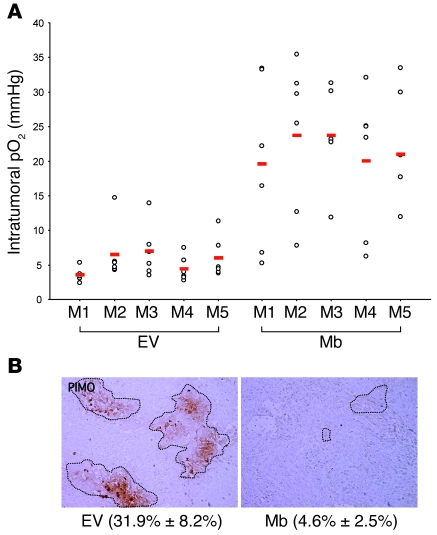
Figure 3. Mb expression promotes tumor oxygenation.
(A) Approximately 5 weeks after tumor cell injection, intratumoral pO2 was measured directly using a ruthenium probe. At least 6 distinct measurements in different tumor locations were performed for each mouse. Red bars indicate average values. M1, mouse 1. (B) Following i.p. injection of pimonidazole hydrochloride, mice were euthanized and tumors extracted for analysis. The extent of tumor hypoxia was determined by immunohistochemical analysis of tumor sections using anti-pimonidazole (PIMO) antibodies. Hypoxia was quantified by calculating the percentage of pimonidazole-positive area (identified by the dotted outlines) over the total area (mean ± SD; in parentheses). Original magnification, ×100.

